How can an object as simple as a cantilever beam be used for process map investigation?
- Koohyar Pooladvand

- Aug 14, 2021
- 5 min read
Updated: Aug 18, 2021
Introduction:
Cantilever and constrained plates and beams have also been employed elsewhere for analyses of the mechanical properties and have proven to be practical for estimating isotropic, orthotropic, and anisotropic elastic properties of different materials. The applied approaches also measured the natural frequencies of the vibrating object to evaluate the elastic moduli in complex multi-layer structures, such as composite materials, which lent itself to additively manufactured plates and beams. Full-field-of-view optical sensors are used to estimate moduli the Poisson’s ratio directly from mode shapes and natural frequency.
Besides, the American Society for Testing and Materials (ASTM) established standards number E-1875 and E-1876 to explain the procedure of evaluation of the dynamic mechanical properties through modal analyses.

Design consideration for testing artifacts for modal analyses
The transverse displacement in an isotropic plate is defined according to the following partial differential equation (PDE):

where, t is time, Γ transverse displacement, σp= pho x h plate area density, Laplace operator, and D flexural rigidity is defined as:

where E is Young’s modulus, h plate thickness, and ν Poisson’s ratio. The solution of this PDE is sought in the form of Γ(x,y)e^iωt by finding the ω satisfying the following equation:

The mathematical and numerical approach to solve this differential equation has been elaborated by G.B. Warburton and A. W. Leissa [2, 3] with the general solution for isotropic material in the Cartesian coordinate system found as a Fourier series as:
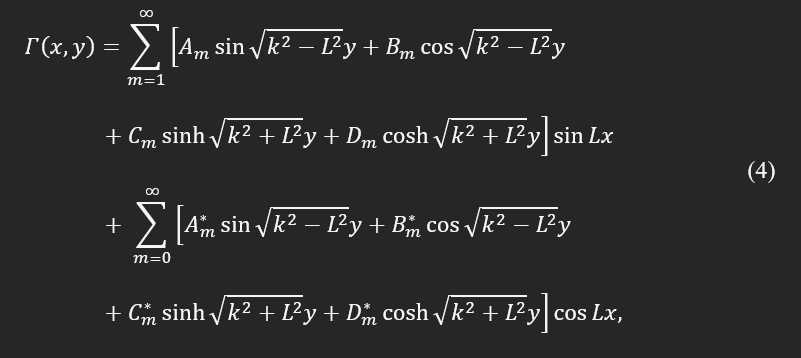
In the above equation, L is the length of the rectangular plate and k^4=phoxω^2/D . In the proposed methodology, the natural frequencies of the cantilever plate are the target of interest and obtained as:
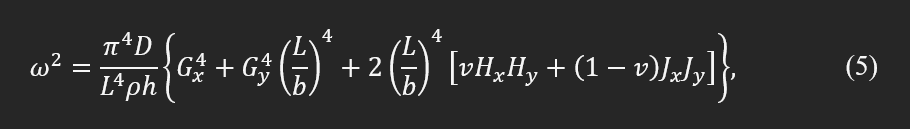
Gx, Gy, Hx, and Hy are constant coefficients as explained by A. W. Leissa [2] and G. B. Warburton [3]. These series of constants depend on boundary conditions, geometry, mode number, and Poisson's ratio.
There are several sources that analytically calculated and experimentally measured these eigenvalues for different boundary conditions and geometry, specifically for a square or rectangular plate; for example, D. Young [4], W. V. Barton [5], and N. W. Bazely et al. [6] investigated these constants.
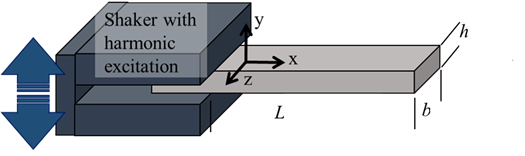
Fig. 1. Representative of the cantilever beam, the boundary condition, dimensions, and the shaker for experimentally determination of the 3D printed testing artifacts.
Rewriting the Eq. (5) in the following format indicates that the non-dimensional eigenvalues for each mode and known boundary condition can be represented only as a function of geometrical characteristics and Poisson's ratio.
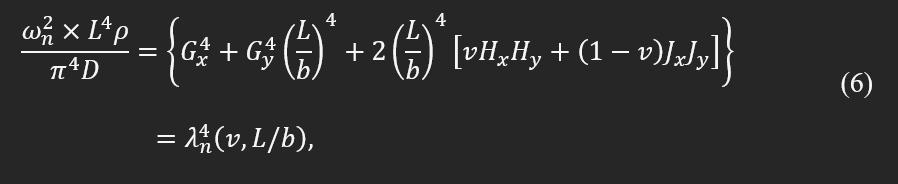
where, λn is a non-dimensional eigenvalue of the plate. It also suggests that the ratio between frequencies is equivalent to their corresponding eigenvalues; such a hypothesis was used in a design on the Poisson’s test plate (Resonalyser procedure) to estimate the Poisson’s ratio directly from two natural frequencies. In addition, the ratio between different natural frequencies can only depend on the Poisson’s ratio. Such a dependency was defined as third-order polynomials and was applied to find the isotropic material properties.
One can analytically seek a solution of Eq. (3) for a simplified geometry, such as a rod or reed with constant cross-section and known geometry, and estimate natural frequencies and mode shapes. For a solid cantilever beam, as shown in Fig. 1, the analytical solution is available in the following terms:
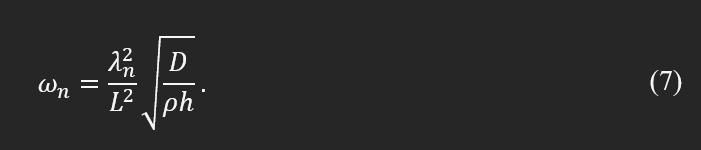
Finding a module of elasticity in a simplified case of a long cantilever thin plate with a large L/b ratio and isotropic property can be formulated based on the natural frequency, density pho, and dimensions as:

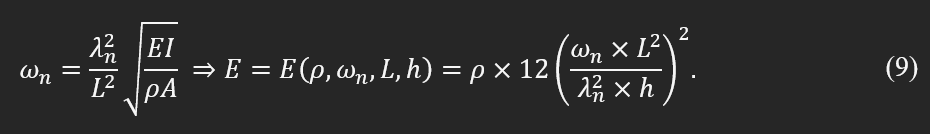
If the sample is a beam with a fixed area, the module of elasticity can be found as:
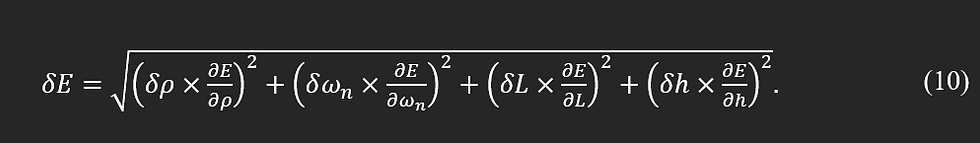
Considering the above definition, the uncertainty in the calculation of the module of elasticity can be found:
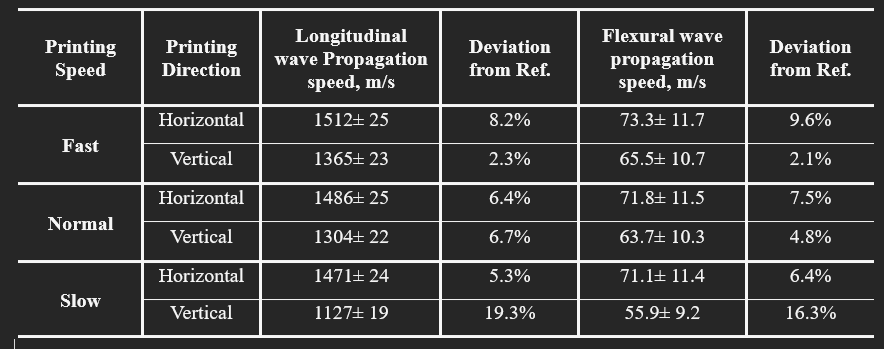
Torsional mode and natural frequencies of testing artifacts with isotropic material
The torsional vibration of a beam with a known and constant cross-section is defined based on the angular displacement along the length of the beam. The following equation defines the governing equations for bar, beam, and rod objects:

where θ is angular displacement, and CT is torsional wave speed. This speed for an isotropic object depends on shear modulus, G, density, pho, polar moment of inertia, IP , and factor χ as defined in the following equation:

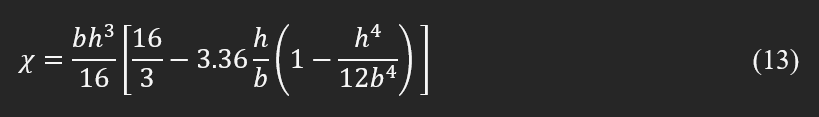
The factor χ is similar to λ, which depends on the geometry, and for a rectangular cross-section (shown in Fig. 1) can be theoretically found as:
The frequency and wavenumber for a cantilever torsional vibration are:
Stress wave and impact study on a thin plate
We did an investigation on the impact test using 3D HS-DIC to illustrate how a thin plate manufactured using the FDM can respond to an impulse force applied by a pendulum at one end of the plate where the other end is fully constrained, similarly to a cantilever beam. The out-of-plane deformations due to this excitation were captured, and the representative results are shown in Fig. 3. The measurement is quantitative, and the full-field at one instance of the excitation is shown in Fig. 3-a. Figure 3-b demonstrates the transient displacement of four representative points out of all available data for a period of 48 milliseconds. The measurement was taken using two high-speed cameras in a stereo configuration with a maximum resolution of 1 megapixel at 200,000 Hz.
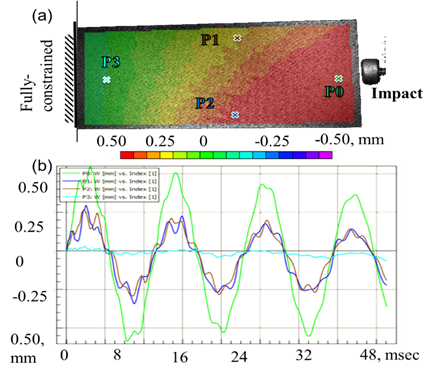
Fig. 3. Representative experimental measurements of out-of-plane deformation in a 3D printed thin plate due to an impact load: (a) one instance of the out-of-plane deformation due to impact load; (b) the transient out-of-plane deformation of four different points.
Stress wave and impact study
Impact studies on 3D printed parts can be performed using high-speed DIC (HS-DIC). Representative results presented in Fig. 104 show the corresponding transient response for impact in x and y directions, respectively. This data was evaluated using Fourier analysis to obtain the natural frequencies and can be used to assess the health and the porosity of the part nondestructively.
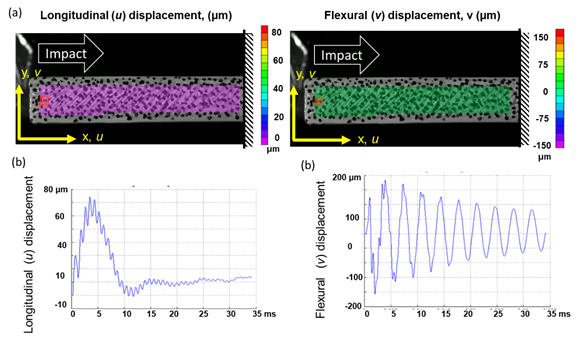
Fig. 4. Representative results of the axial impact on a 3D printed component by HS-DIC: (a) side view of the artifacts prepared for DIC measurements also showing the location of the impactor; (b) displacements in the x-direction, u, for 35 msec; and (c) displacements in the y-direction, v, for 35 msec.
Impact analyses
The elasticity modulus can be estimated knowing the wave speeds. Table 1 shows the estimated speed for both longitudinal and flexural directions and its uncertainties. They are also plotted in Fig. 5, where one can see the effect of printing speed and orientation better. The results show the same trends seen for elasticity as expected. This method exhibits a potential for measuring the material properties, and through that, one can be able to find also other critical parameters such as damping and defects.
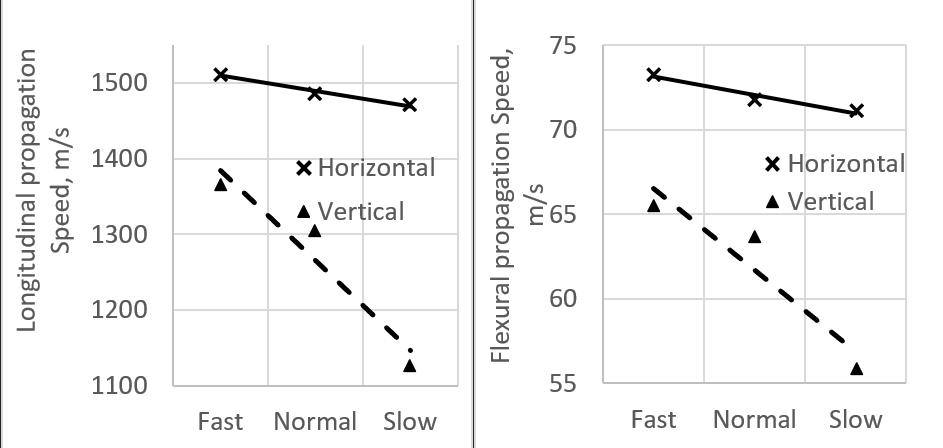
Fig. 5.Group velocities calculated for the six 3D printed cantilever beams under horizontal and vertical orientations with three speed levels speed calculated showing strong effects of speed and orientation: (a) Longitudinal; and (b) Flexural speeds.
Table 1: Recovered moduli of elasticity of testing artifacts when fabricated at varying printing speeds and orientations. Experimentally obtained first modes of vibration were utilized. Pristine ABS filament with a reference module of elasticity of 2,030 MPa was used to compute deviations.
References:
[1] Pooladvand, K., 2019, "Multifunctional Testing Artifacts for Evaluation of 3d Printed Components by Fused Deposition Modeling," Worcester Polytechnic Institute, [Link].
[2] Leissa, A. W. J. V. o. p., 1969, "NASA SP-160," pp. 59-60.
[3] Warburton, G., 1954, "The vibration of rectangular plates," Journal Proceedings of the Institution of Mechanical Engineers, 168(1), pp. 371-384.
[4] Young, D. J. J. a. M., 1950, "Vibration of rectangular plates by Ritz method," 17, pp. 448-453.
[5] Barton, M. J. J. O. A. M.-T. O. T. A., 1951, "Vibration of rectangular and skew cantilever plates," 18(2), pp. 129-134.
[6] Bazley, N. W., Fox, D. W., Stadter, J. T. J. Z. J. o. A. M., and Mechanik, M. Z. f. A. M. u., 1967, "Upper and lower bounds for the frequencies of rectangular cantilever plates," 47(4), pp. 251-260.
[7] Lauwagie, T., Sol, H., Roebben, G., Heylen, W., Shi, Y., and Van der Biest, O., 2003, "Mixed numerical–experimental identification of elastic properties of orthotropic metal plates," NDT & E International, 36(7), pp. 487-495.

Comments